Give a warm welcome to Netdata v1.31.0, which features:
- Re-packaged and redesigned dashboard: A more informational and feature-rich “frame” for your monitoring and troubleshooting sessions.
- eBPF expands into the directory cache: Monitor whether your services or applications are properly using Linux’s memory management for the best performance and minimal disk I/O.
- Machine learning-powered collectors: Detect anomalies using only your own data and minimal resource utilization on your monitored nodes.
- An improved Netdata learning experience: A timeline of new content, refreshed visuals, and a newly-open sourced repository.
Re-packaged and redesigned dashboard
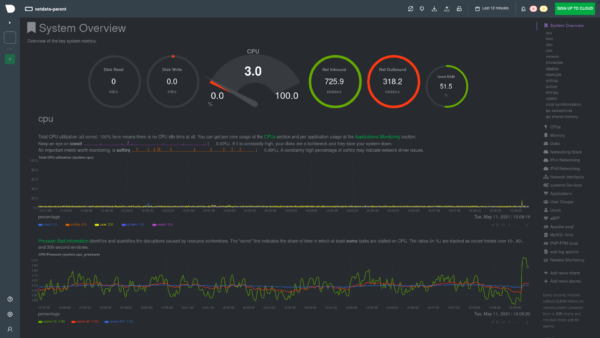
We re-packaged and redesigned portions of the dashboard to improve the overall experience. Part of this effort is better handling of dashboard code during installation—anyone using third-party packages (such as the Netdata Homebrew formula) will start seeing new features and the new designs starting today.For those who aren’t using third-party packages (thank you!), your installation process will still get a little bit faster.
img
A change we’ve made to help with this is moving the timeframe picker to the top bar to make it easier to find, while also providing more viewing space for your dashboards.
Just to the right of the picker is the new alert status section, which uses two counters to show live counts of CRITICAL and WARNING alerts on your node. Click either of them to open the alerts modal.
In-product documentation and settings have been moved to the left sidebar to differentiate between how you configure Netdata and how you actively use Netdata.
Even more dashboard improvements are coming, so stay tuned.
eBPF expands into the directory cache
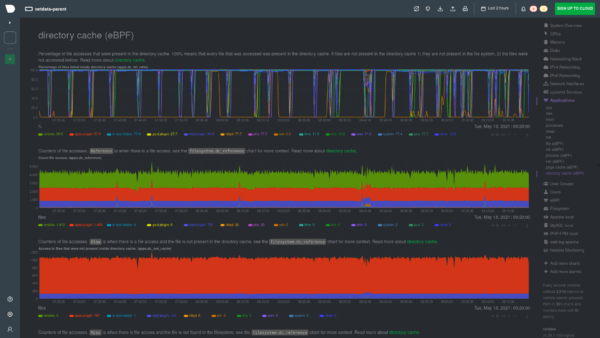
We’re continuing to delve deep into helping you monitor exactly how your services and applications are interacting with the Linux kernel and deliver insights that you can’t get from other monitoring solutions.Our latest advancement is in monitoring the directory cache (d-cache), which holds a portion of your filesystem in memory to speed up the way applications look up and access files. This new eBPF program watches Linux kernel activity to to identify when services or applications are looking for files that don’t exist in the directory cache or are not found entirely.
By monitoring the directory cache, developers and SREs alike can easily find opportunities to optimize memory usage and reduce disk-intensive operations.
If you’ve had Netdata installed on your node for a while, you might need to manually enable the new directory cache collector. Connect to your node with SSH and navigate to the Netdata config directory, which is usually /etc/netdata. Then open ebpf.d.conf for editing:
sudo ./edit-config ebpf.d.confCheck to see if the dcstat setting is set to yes. If not, make that change and save the file. While you’re here, you might as well enable cachestat, which was released in v1.30.0, if it’s not already.
[ebpf programs] cachestat = yes dcstat = yes ...
Restart Netdata with sudo systemctl restart netdata and refresh the dashboard to launch the new directory cache collector. You’ll find these charts in the Applications section, under the submenu directory cache (eBPF).
Machine learning-powered collectors
While we already have Metric Correlations for Netdata Cloud users, we’re constantly exploring new ways to bring machine learning-based anomaly detection features to individual, distributed nodes running our open-source monitoring agent. This would give you the flexibility to detect anomalies anywhere, even on systems that are “air-gapped” from the rest of the internet.Our new Z-scores and changefinder collectors offer two new ways to perform on-device machine learning.
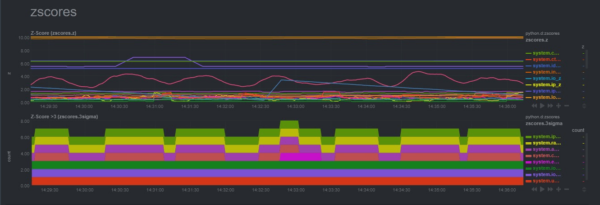
Z-scores visualize which metrics are deviating from their mean, and by how many standard deviations. It’s a simple calculation, but when performed every 5 seconds, using your own real-world metrics, it’s a phenomenally easy way to get instant feedback when essential services/applications are running amok.
The changefinder collector returns a changepoint score for every chart or dimension you configure it to monitor, and it evolves over time as new metrics roll in. Because there’s no batch training, this type of machine learning is scalable—ideal for situations where you need to monitor lots of charts, or have many child nodes all streaming their metrics to a single parent to do all the heavy ML lifting.
Keep in mind that as with all things ML, these collectors are a bit of an experiment. Take care if you’re using them in production environments and drop a note on the community forum or at analytics-ml-team@netdata.cloud with any and all feedback, both positive and negative. Your feedback is priceless when it comes to helping us make complex features more useful.
An improved Netdata learning experience
While not technically a part of the latest release of the open-source Netdata monitoring agent, we’re proud to have released a refreshed version of our documentation and educational site, Netdata Learn, just last week.
The homepage now features a timeline of the latest new collectors, guides, and educational content that we’ve released. There’s refreshed visuals throughout, faster paths to various documentation, and a clearer distinction between the open-source Netdata monitoring agent and Netdata Cloud.
While there’s always been search functionality built into Netdata Learn, we’ve made it a bit more obvious and added a more obvious keyboard shortcut. Hit Ctrl/⌘ + k to start a new search!
We also made the repository for this website public for the first time. Feel free to poke around, see how the sausage is made, or even suggest improvements via the issues or PRs. We’re excited to bring the community into the fold on how we manage and deploy our documentation! There’s plenty more features coming soon, and we’ll keep you apprised of them as they’re pushed into production.
Community
The Netdata community continues to grow since our last major release (v1.30.0):- 24 independent contributors added 45 contributions to this release
- 3,000+ members actively participated in GitHub
- On GitHub, we’ve reached 52,333 stars
- @jsoref for fixing numerous spelling mistakes.
- @Steve8291 for improving plugins error logging on restart and documentation improvement.
- @vincentkersten for updating the nvidia-smi collector documentation.
- @Avre for updating the install on cloud providers doc.
- @endreszabo for adding renaming libvirtd LXC containers support.
- @RaitoBezarius for adding attribute 249 support to the smartd_log module.
- @Habetdin for updating the fping version.
- @wangpei-nice for fixing .deb and .rpm packaging of the eBPF plugin.
- @tiramiseb for improving the installation method for Alpine.
- @BastienBalaud for upgrading the OKay repository for RHEL8.
- @tknobi for adding the Nextcloud plugin to the third-party collector list.
- @jilleJr for adding IPv6 listen address example to the Nginx proxy doc.
- @cherouvim for formatting and wording in the Apache proxy doc.
- @yavin87 for fixing spelling in the infrastructure monitoring quickstart.
- @tnyeanderson for improving dash-example.html.
- @tomcbe for fixing Microsoft Teams notification method naming.
- @tnyeanderson For improving the dash-example documentation.
- @diizzyy for fixing a bug in the FreeBSD plugin.
Check out the release notes on GitHub for a changelog of every bug fix and improvement.
Install or update Netdata
If you don’t yet have Netdata, which is always free and open source, you can get started with a single command on most Linux systems: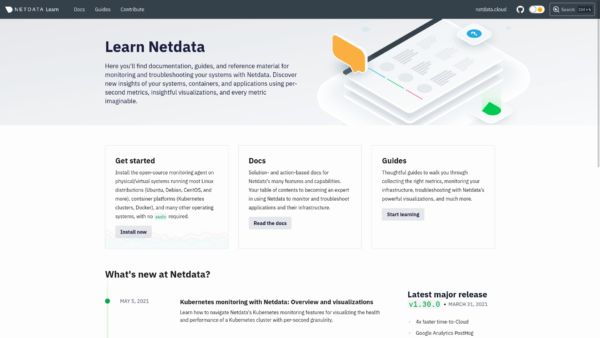
bash <(curl -Ss https://my-netdata.io/kickstart.sh)To expand from monitoring a single node with Netdata to an infrastructure of distributed nodes, check out Netdata Cloud, which brings metrics from many nodes into a unified view with real-time, on-demand streaming.
