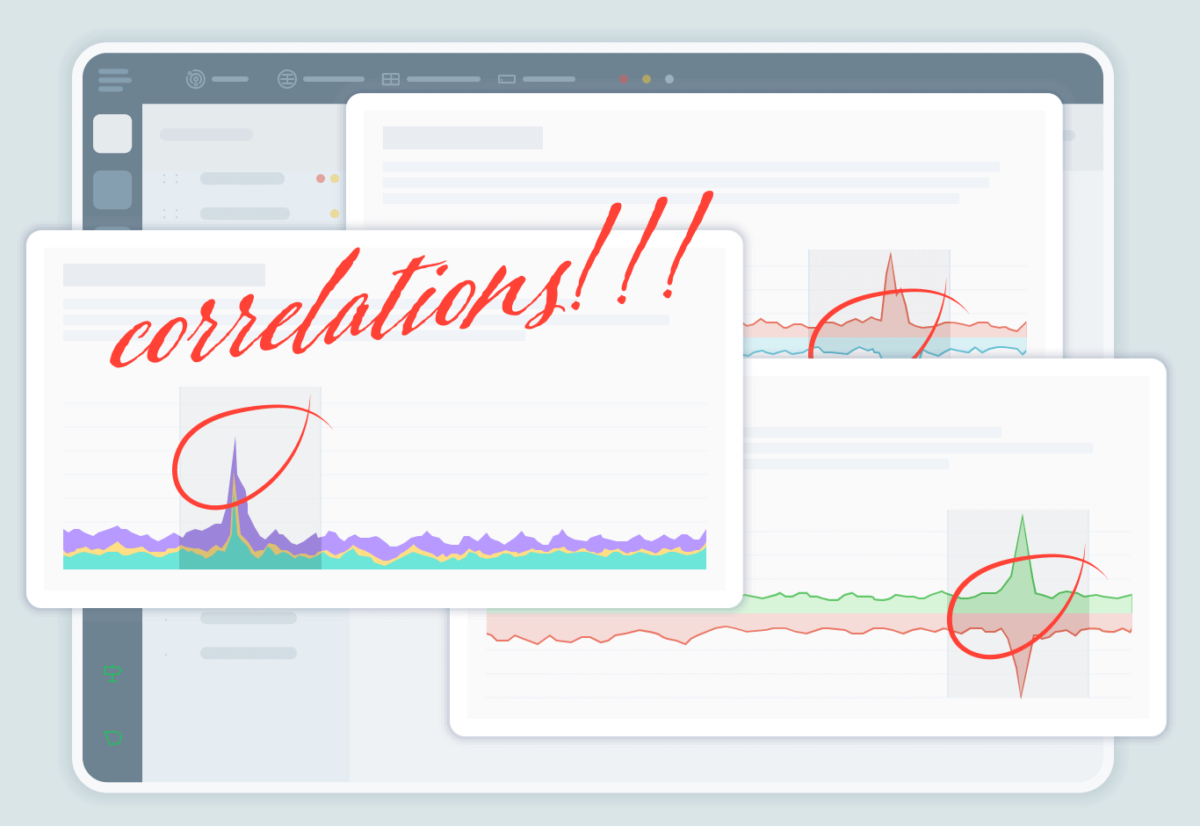
Today, we are excited to launch our first Netdata Cloud Insights feature, Metric Correlations, developed for discovering underlying issues more quickly and identifying the root cause more efficiently. Read on to learn more about our approach to developing this new feature, how it works, and the many benefits you’ll find incorporating this into your team’s troubleshooting workflow.
Some background
Let’s start with a bit of a disclaimer. It seems machine learning (ML) (or “Artificial Intelligence,” if you are looking for more LinkedIn likes) has gone mainstream in the last few years, and we are probably by now somewhere near the “Peak of Inflated Expectations” on the hype cycle. It is in this context that we want to be clear about what our goals are in this space and our approach to releasing data-driven features that draw on techniques from statistics and ML. In short, we want to be clear, open, realistic, and avoid buzzwords at all costs!Over the next 12 months, we are hoping to begin building a layer of intelligence1 throughout Netdata (both Cloud and Agent) to assist with “human in the loop” troubleshooting, mainly to help users more easily surface slowdowns, anomalies, or other issues and lower your cognitive load2 as you troubleshoot using Netdata. Simply put, we’re working to streamline your mean time to resolution (MTTR).
We are not promising self-driving, self-healing monitoring that will tuck you in at night, and you should treat anyone who does with caution, as you should with a lot of the buzz you might see right now around the whole “AIOps” market itself.
Bringing tools and techniques from statistics and machine learning to bear will certainly help make better data-driven products across almost all industries. But we humans are not surplus to these requirements just yet, especially in a space like monitoring where complexity and nuances only grow as systems and infrastructure evolve in parallel with technology.
Rather, our approach for the short-to-medium term will be to add smaller, data-driven features to key parts of how people already interact with Netdata, as well as some completely new approaches to how you can monitor your systems with Netdata. In principle, however, these will typically be features to help “assist and suggest” as opposed to providing blind automation.
Using Metric Correlations
In this vein, it is fitting that the default approach of our first release of the Metric Correlations feature uses a well established statistical method to surface charts that might be of interest given a specific window of focus you select.The use case is this: You see something strange on some chart you are looking at somewhere in Netdata Cloud and would like to identify and analyze the affected metrics and more importantly, the metrics that will lead you to pinpoint a potential root cause. Go to Insights > Metric Correlations, highlight the area of interest, and click the Find Correlations button.
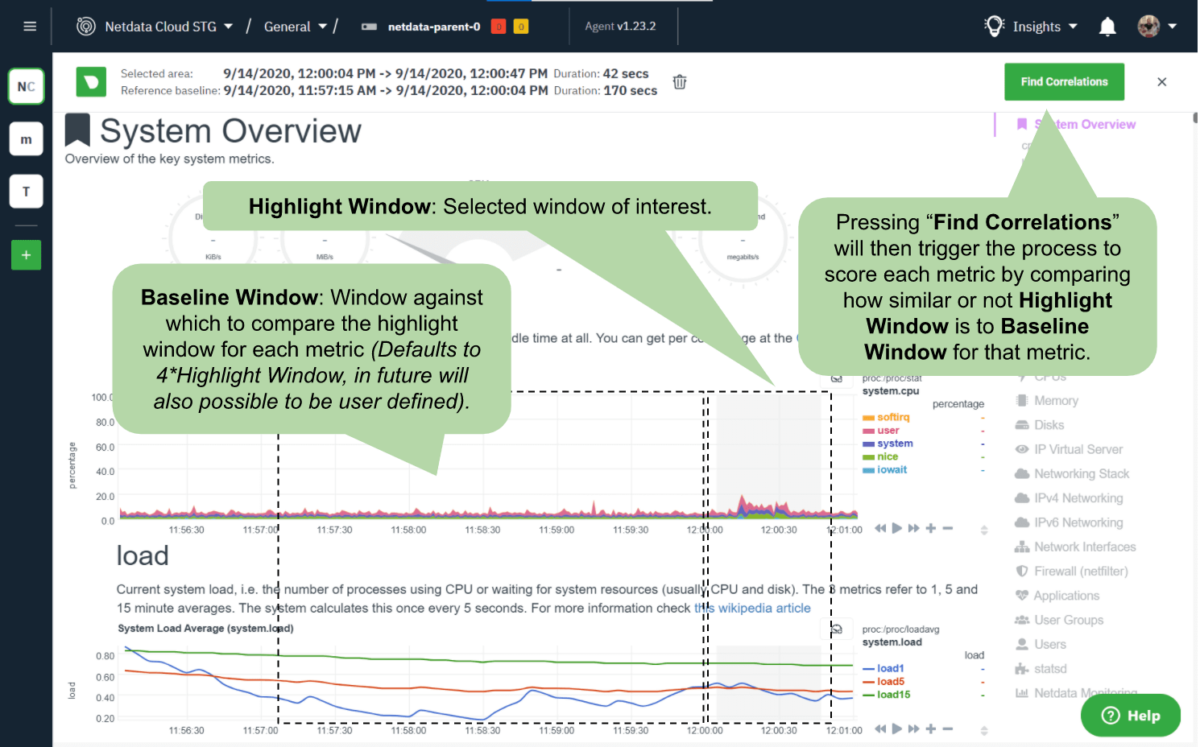
The Metric Correlations feature will look at all the dimensions available to see which have also changed in a significant way in comparison to a baseline window (which currently defaults to an area just before your window of interest, but will be customizable in the future).
Admittedly, the “correlation” here then is a bit indirect, in that what you are really doing is many separate comparisons, one for each metric independently, between the baseline window and the highlighted window you have selected, and then prioritizing those metrics that seem to have changed the most across those two windows. Everything that we can score is returned3. The picture below might explain things a bit more clearly.

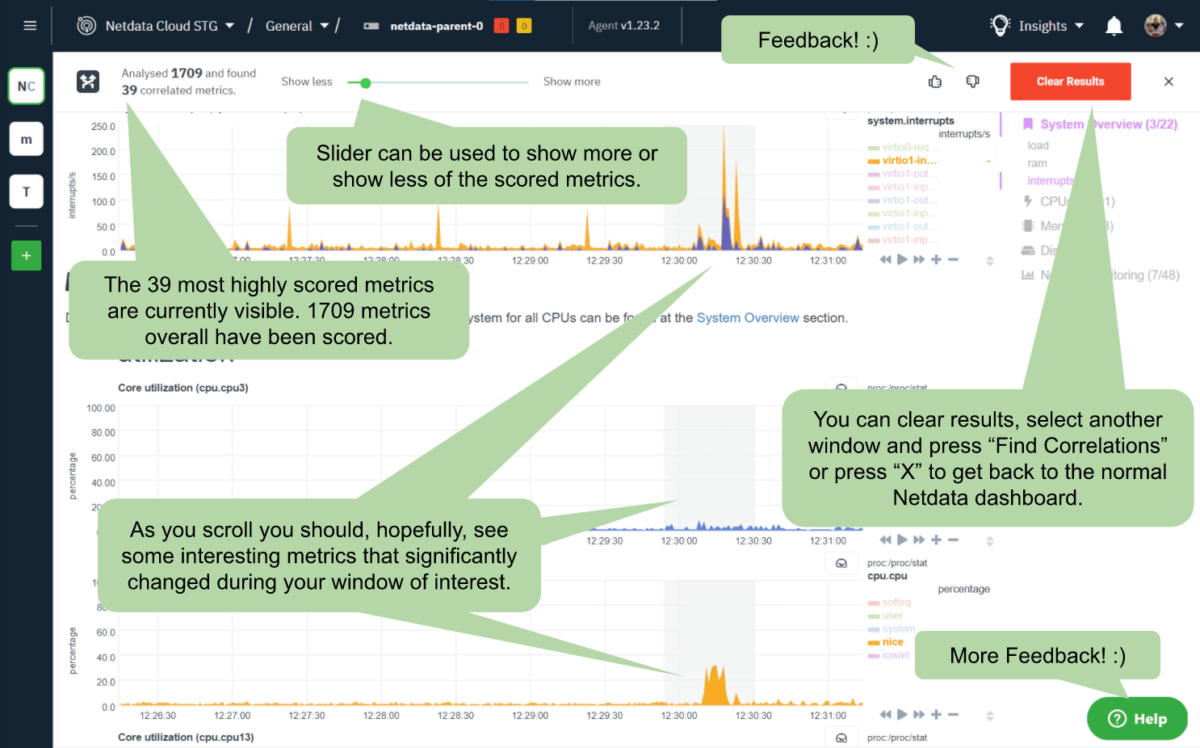
The results you get are the usual Netdata interface and charts, but with only the metrics with a score below a threshold defined by the slider4. Moving the slider to the right (towards Show more) will loosen this threshold and likely include somewhat less relevant results. If you move the slider to the left (towards Show less), then you should only see the metrics that have changed the most5.
Below is a picture of how this looks and what you are looking at.

Thoughts, ideas, feedback? We want to hear from you!
Feedback on the features we introduce is crucial for our plans to refine and improve, as well as decide where else to focus our efforts for new or related ideas. If you are using this feature and feel strongly enough to provide any sort of feedback, positive or negative, you can use the thumbs up or down button or the Help widget on the bottom right if you’d like to give more detailed feedback as shown in the diagram above.Feel free to also reach out to us on the Netdata Community forums; we’d be happy to chat more and learn what other features you might be interested in seeing added to our roadmap.
That’s it! We hope you find this feature useful and that it saves you a few precious minutes the next time you have a problem that needs troubleshooting.
1“Layer of intelligence” is maybe a buzz phrase. Apologies; it seems they are hard to avoid.2We are allowing ourselves to use buzzwords from psychology. 🙂3Lots of dimensions and charts will typically be filtered as unscored due to things like being a single constant value or having insufficient data for scoring. Your scored metrics will almost always be fewer than all available metrics.4 Currently a p-value <=0.15 There may be false positives from the algorithm (as you might expect with any other). 🙂