Your application isn’t finished when you’ve closed the last if block and you lined up all the brackets. There’s a whole other world of testing, debugging, and optimization that you haven’t even touched yet.
To help you more safely step into that complex phase of making your application even better, we’ve just released a brand-new eBPF collector in v1.20 of Netdata. With this collector enabled, you can monitor real-time metrics of Linux kernel functions and actions from the very same monitoring and troubleshooting dashboard you use for watching entire systems, or even entire infrastructures.
With per-second metrics on system calls, file descriptors, virtual file system I/O, and process management, you can debug faster, get smarter about performance optimization, and save some of your valuable time.

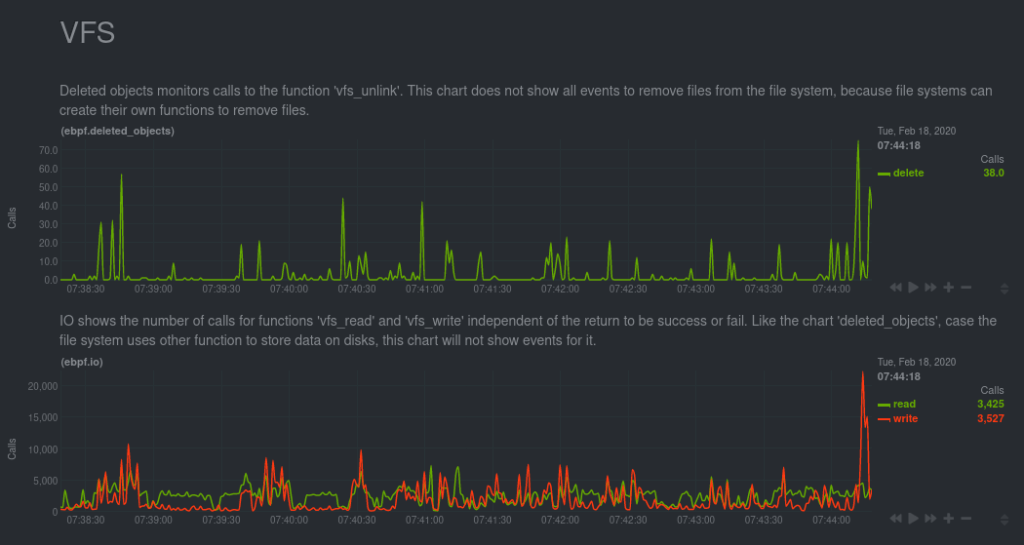
An example of virtual file system (VFS) charts, made possible by the eBPF collector plugin
What is eBPF?
eBPF (extended Berkeley Packet Filter) is a virtual bytecode machine built into the Linux kernel that can be used for advanced monitoring and tracing. With eBPF, you can get detailed metrics about I/O and filesystem latency, CPU usage by process, and network performance, all while executing code in a safe and fast sandbox. You don’t need to recompile your kernel after building a custom module, and with eBPF, there’s no risk of crashing the kernel.You can use eBPF to analyze how and when a process accesses files, when it makes system calls, whether it’s leaking memory or creating zombie processes, and a whole lot more. Several eBPF programs already exist, such as bpftrace and bcc-tools, and other well-known tools like tcpdump are converted into eBPF programs to return data.
Brendan Gregg of Netflix has called eBPF a “superpower” and claims “eBPF does to Linux what JavaScript does to HTML”.
How Netdata monitors eBPF metrics
Thanks to the new eBPF collector released in v1.20 of Netdata, you now have access to this superpower!To enable eBPF metrics collection, we wrote two custom eBPF programs for Netdata. The default, called entry, monitors calls to a variety of kernel functions, such as do_sys_open, __close_fd, vfs_read, vfs_write, _do_fork, and more. The return program also monitors the return of each kernel functions (aka errors) to give even more visibility into your system.
The eBPF collector then performs some calculations on the volume of these calls to update Netdata’s charts every second. Right now, the eBPF collector can track a number of valuable metrics:
- Open/closed file descriptors
- Virtual file systems: deleted objects, IO calls, and bytes read/written
- Processes and threads created
- Exited tasks, including possible zombie processses
Troubleshoot application performance with eBPF
In the Files section, Netdata monitors how many files various processes open and close during each second-long interval. If you enable thereturn eBPF program, which does require a little more resources, you can also view errors returned on calls to do_sys_open and __close_fd.Let’s say you’re building an application and notice that after running it for an extended time, the host system slows down. There could be a lot of reasons for this, but one could be that your application is opening files but not properly closing them after an appropriate time. In this case, you would see the two lines in the first chart diverge, as there are more open descriptors than closed.

See how the green (open) line is generally larger than the red (close) line? This discrepancy could reveal bugs in your application.
Too many open files could be responsible for slowing down the system. It may not be the root cause of your application’s performance troubles, but you can use this valuable information to debug your application by focusing on where it opens and closes files using functions likeopen(2), openat(2), and close(2).Combine Netdata’s real-time metrics with eBPF tools
Having real-time eBPF metrics on hand can help guide you to the next stage in troubleshooting anomalies with your applications and services. For example, theebpf.io chart shows the volume of calls to the vfs_read function. Is that number is suspiciously high all of a sudden? Maybe it’s to move to the command line.
Detailed I/O information from the kernel can help you decide where to go next in your debugging journey.
You can usebpftrace to produce a histogram of vfs_read latency for a program running on a certain PID. In this case, a Netdata agent running on PID 1499.bpftrace -e 'kretprobe:vfs_read /
pid == 1499 /
{ @bytes = hist(retval); }
'Attaching 1 probe...^C@bytes:
[0] 5690 |@@@@@@@@@@@@@@@@@@@@@@@@@@@@@@@@@@@@@@@@@@@@@@@@@@@@|[1] 78 | |[2, 4) 325 |@@ |[4, 8) 477 |@@@@ |[8, 16) 2983 |@@@@@@@@@@@@@@@@@@@@@@@@@@@ |[16, 32) 1190 |@@@@@@@@@@ |[32, 64) 429 |@@@ |[64, 128) 123 |@ |[128, 256) 224 |@@ |[256, 512) 1995 |@@@@@@@@@@@@@@@@@@ |[512, 1K) 1244 |@@@@@@@@@@@ |[1K, 2K) 155 |@ |[2K, 4K) 373 |@@@ |[4K, 8K) 95 | |
If a tool like bpftrace reveals that your application is making too many small-byte reads, maybe there’s an opportunity to optimize it and improve overall performance. By correlating Netdata’s real-time metrics with other eBPF tools, you can more quickly determine which next steps you should take to troubleshoot and resolve a performance anomaly in your applications.
Find and eliminate the zombies
In the Process group, theebpf.exit chart monitors two cruical moments in the lifecycle of a process or thread. First, with the green process dimension, when the process/thread tells the kernel it’s ready to be stopped. Second, with the orange task dimension, when the process is stopped and removed from the queue. But what if these events do not happen in sequence, as expected?A zombie process is born.And that is exactly what the ebpf.process_status chart is for: It shows both the difference between processes and threads created via the process dimension, but also the number of possible zombie processes running on the system. For example, if you create a few thousand zombie processes with a “zombie factory” program:

Zombie processes galore! With eBPF, you know exactly when your system fails to stop tasks and spawns yet another zombie.
Knowing when your system creates zombie processes can be invaluable in diagnosing why your software isn’t working the way you expect.What’s next?
Our eBPF collector is by no means finished. Future releases will include dramatic improvements to which eBPF metrics you can collect, how they’re visualized on Netdata’s dashboard, and more content about how you can use these real-time kernel metrics for tracing and debugging all things Linux kernels. Until then, we encourage you to poke around and let us know if you have ideas about how we could improve it in further releases.New installations of the Nedata Agent will have eBPF monitoring installed and enabled by default, so go ahead and download the Agent. Then, navigate to http://localhost:19999 or http://NODE:19999to see real-time eBPF metrics on your dashboard!
